How Columbus Has Voted: Muscogee County's Results in 19 Presidential Races Since 1952

Muscogee County has voted for president in every election since 1952. Here's how. Illustration: AI-generated
Columbus, Ga., has voted Democratic for president in nine consecutive elections since 1992, after voting Republican as recently as 1988. Muscogee County also voted against Georgia's statewide winner in both the 2018 and 2022 governor's races, according to historical election results.
Those voting patterns provide context ahead of Georgia's Nov. 3, 2026, governor's election, when voters will choose between Democrat Keisha Lance Bottoms and Republican Rick Jackson.
A review of Muscogee County's presidential results from 1952 through 2024 shows considerable changes over the decades. Republican Dwight Eisenhower carried the county by just 16 votes in 1956. George Wallace won the county as the American Independent candidate in 1968. Republican Richard Nixon received 77.6% of the vote in 1972, while Democrat Jimmy Carter received 64.1% four years later.
More recently, Democratic presidential candidates received 61.4% of the county vote in both 2020 and 2024. The 2020 election also produced the highest total presidential vote count in the historical figures examined, with 80,528 votes.
Here is how Muscogee County's voting history compares across elections, including presidential races, Georgia governor contests and recent U.S. Senate elections.
How has Muscogee County voted for president since 1952?
Muscogee County has voted Democratic in every presidential election since 1992, following a period when both major parties won the county.
The historical results cover 19 presidential elections from 1952 through 2024. The table lists Republican and Democratic vote totals, their shares of the total vote, and the winning candidate or party in Muscogee County.
| Year | Republican votes | Republican share | Democratic votes | Democratic share | County winner |
|---|---|---|---|---|---|
| 1952 | 7,814 | 41.1% | 11,220 | 58.9% | Democratic |
| 1956 | 8,176 | 50.0% | 8,160 | 50.0% | Republican |
| 1960 | 9,578 | 52.8% | 8,553 | 47.2% | Republican |
| 1964 | 21,025 | 62.8% | 12,446 | 37.2% | Republican |
| 1968 | 11,193 | 32.4% | 7,593 | 22.0% | Wallace, American Independent |
| 1972 | 28,449 | 77.6% | 8,234 | 22.4% | Republican |
| 1976 | 13,496 | 35.9% | 24,092 | 64.1% | Democratic |
| 1980 | 15,203 | 38.4% | 23,272 | 58.8% | Democratic |
| 1984 | 23,816 | 53.3% | 20,835 | 46.7% | Republican |
| 1988 | 23,058 | 54.9% | 18,772 | 44.7% | Republican |
| 1992 | 21,386 | 41.7% | 25,476 | 49.7% | Democratic |
| 1996 | 19,360 | 41.9% | 24,867 | 53.8% | Democratic |
| 2000 | 23,479 | 45.0% | 28,193 | 54.0% | Democratic |
| 2004 | 30,850 | 48.2% | 32,867 | 51.3% | Democratic |
| 2008 | 29,568 | 39.9% | 44,158 | 59.5% | Democratic |
| 2012 | 27,510 | 38.9% | 42,573 | 60.2% | Democratic |
| 2016 | 26,976 | 38.8% | 39,851 | 57.3% | Democratic |
| 2020 | 30,107 | 37.4% | 49,446 | 61.4% | Democratic |
| 2024 | 30,616 | 38.0% | 49,413 | 61.4% | Democratic |
Percentages are rounded. Minor-party and independent votes are included in the percentage calculations where applicable. In 1968, Wallace received 15,804 votes, or 45.7%. Other-candidate totals specifically identified in the historical results include 1,091 in 1980, 4,418 in 1992 and 2,698 in 2016.
The table shows several changes in the county's presidential voting history. Republican candidates carried Muscogee in 1956, 1960, 1964, 1972, 1984 and 1988, while Democratic candidates won the other elections except 1968.
The most recent Republican presidential victory in Muscogee occurred in 1988. Since then, the Democratic candidate has received more votes than the Republican candidate in every presidential election.
How did Eisenhower win Muscogee County by just 16 votes in 1956?
Republican Dwight Eisenhower carried Muscogee County in 1956 by 8,176 votes to 8,160, a margin of only 16 votes.
Both candidates' shares round to 50.0%, making the election appear tied when viewed only through percentages. The actual vote totals establish Eisenhower's narrow victory.
The result represented a change from 1952, when the Democratic candidate received 11,220 votes, or 58.9%, compared with 7,814 Republican votes.
Republicans also won Muscogee County in 1960 and 1964. Their share increased from 52.8% in 1960 to 62.8% in 1964.
These elections demonstrate why looking at actual vote counts is important. Rounded percentages can conceal a narrow result such as the 1956 election, while longer-term comparisons show changes in the parties' shares.
What happened in Muscogee County in 1968?
George Wallace won Muscogee County's 1968 presidential vote as the American Independent candidate, receiving 15,804 votes and 45.7%.
The Republican candidate received 11,193 votes, or 32.4%, while the Democratic candidate received 7,593 votes, or 22%.
Wallace finished ahead of both major-party candidates, making 1968 the only presidential election in the 1952-2024 table won locally by a candidate outside the Republican and Democratic parties.
The results are significant when comparing historical party shares because the county's vote was divided among three candidates. Neither major party received a majority of the county vote.
Four years later, the presidential results looked substantially different, with the Republican candidate receiving more than three-quarters of the vote.
When did Republicans receive their highest vote share in Columbus?
Republicans recorded their highest presidential vote share in the historical table in 1972, when Richard Nixon received 77.6% of Muscogee County's vote.
The Republican total was 28,449 votes, compared with 8,234 votes, or 22.4%, for the Democratic candidate.
The 55.2-percentage-point difference between the two parties was the largest Republican percentage advantage in the presidential results examined.
The election also marked a change from 1968, when Wallace had finished first and the Republican candidate received 32.4%.
However, the 1972 result did not establish a continuous period of Republican presidential victories. The Democratic candidate won Muscogee County in the next two elections, beginning with 1976.
What changed in the 1976 presidential election?
Democrat Jimmy Carter carried Muscogee County in 1976 with 64.1% of the vote, the highest Democratic presidential share in the 1952-2024 table.
Carter received 24,092 votes, compared with 13,496 Republican votes, or 35.9%.
The difference between the Republican share in 1972 and the Democratic share in 1976 illustrates the change between consecutive elections. Republicans received 77.6% in 1972, while Democrats received 64.1% four years later.
Democrats also carried Muscogee in 1980, with 23,272 votes and 58.8%. Republicans received 15,203 votes, or 38.4%, and other candidates received 1,091.
The county then voted Republican in 1984 and 1988. The 1988 result would become the last Republican presidential victory in Muscogee through the most recent election in 2024.
When did Muscogee County last vote Republican for president?
Muscogee County last voted Republican for president in 1988, when the Republican candidate received 23,058 votes, or 54.9%.
The Democratic candidate received 18,772 votes, or 44.7%.
Four years later, the Democratic candidate won the county with 25,476 votes, representing 49.7%. Republicans received 21,386 votes, or 41.7%, and other candidates received 4,418 votes, or 8.6%.
The 1992 result began the current sequence of nine consecutive Democratic presidential victories in Muscogee County.
From 1992 through 2024, Democrats won every presidential contest in the county, although their vote shares and winning margins varied. The Democratic share was 49.7% in 1992, reached 60.2% in 2012 and stood at 61.4% in both 2020 and 2024.
The sequence includes the elections of 1992, 1996, 2000, 2004, 2008, 2012, 2016, 2020 and 2024.
How close was the 2004 presidential election in Columbus?
The 2004 presidential contest was Muscogee County's closest since 1988, with the Democratic candidate winning by 2,017 votes.
The Democratic candidate received 32,867 votes, or 51.3%, compared with 30,850 Republican votes, or 48.2%.
The margin was approximately 3.1 percentage points, considerably smaller than the Democratic margins in several subsequent elections.
In 2008, Democrats received 44,158 votes, or 59.5%, compared with 29,568 Republican votes, or 39.9%. The Democratic share rose to 60.2% in 2012, while the Republican share was 38.9%.
In 2016, Democrats received 57.3% and Republicans received 38.8%, with other candidates accounting for 3.9%.
These figures show that the county's nine-election Democratic winning sequence included contests with different margins. A consistent winning party does not mean identical voting percentages from one election to the next.
What happened in the 2020 and 2024 elections?
Democratic presidential candidates received 61.4% of the Muscogee County vote in both 2020 and 2024, the highest Democratic share since 1976.
The 2020 Democratic total was 49,446 votes, compared with 30,107 Republican votes. A total of 80,528 presidential votes were cast, the highest total in the historical table.
In 2024, the Democratic candidate received 49,413 votes and the Republican candidate received 30,616. Total presidential votes were 80,491.
That means the Democratic total decreased by 33 votes between 2020 and 2024, while the Republican total increased by 509. The overall vote total decreased by 37.
| Measure | 2020 | 2024 |
|---|---|---|
| Democratic votes | 49,446 | 49,413 |
| Republican votes | 30,107 | 30,616 |
| Democratic share | 61.4% | 61.4% |
| Republican share | 37.4% | 38.0% |
| Total presidential votes | 80,528 | 80,491 |
Although the Democratic percentage rounded to the same figure in both elections, the underlying vote totals were not identical.
The two elections also recorded the highest total presidential vote counts in the period examined. Total votes, however, are not the same as voter turnout expressed as a percentage of registered or eligible voters.
How has Columbus voted compared with Georgia statewide?
Muscogee County and Georgia have selected different presidential parties in seven of the nine elections since 1992.
During that period, Muscogee voted Democratic every time. Georgia voted Democratic in 1992 and 2020, but Republican in 1996, 2000, 2004, 2008, 2012, 2016 and 2024.
| Election year | Muscogee County winner | Georgia statewide winner | Same party? |
|---|---|---|---|
| 1992 | Democratic | Democratic | Yes |
| 1996 | Democratic | Republican | No |
| 2000 | Democratic | Republican | No |
| 2004 | Democratic | Republican | No |
| 2008 | Democratic | Republican | No |
| 2012 | Democratic | Republican | No |
| 2016 | Democratic | Republican | No |
| 2020 | Democratic | Democratic | Yes |
| 2024 | Democratic | Republican | No |
The comparison establishes that a county's presidential results do not necessarily match the statewide result.
For example, Muscogee voted Democratic in 2004 by 2,017 votes, while Georgia voted Republican statewide. In 2020, both the county and the state voted Democratic.
These results describe past elections only. They do not establish what will happen in a future presidential or statewide election.
How did Muscogee County vote for governor in 2018?
Muscogee County voted for Democrat Stacey Abrams in 2018, while Republican Brian Kemp won the election statewide.
Abrams received 38,462 votes in Muscogee, compared with Kemp's 24,348. Other candidates received 462 votes, bringing the county total to 63,272.
| 2018 candidate | Muscogee votes | County share | Georgia statewide votes | Statewide share |
|---|---|---|---|---|
| Brian Kemp (R) | 24,348 | 38.48% | 1,978,408 | 50.22% |
| Stacey Abrams (D) | 38,462 | 60.79% | 1,923,685 | 48.83% |
| Other | 462 | 0.73% | — | — |
Muscogee gave Abrams 14,114 more votes than Kemp. Statewide, Kemp finished ahead of Abrams by 54,723 votes.
The county and statewide percentages therefore show different outcomes. Abrams received more than 60% in Muscogee, while Kemp received more than 50% statewide.
The difference between the county and state results is relevant when examining how Columbus has voted in recent governor's elections.
Did Muscogee vote differently from Georgia in 2022?
Yes. Muscogee again voted for Stacey Abrams in 2022, while Brian Kemp won statewide.
Abrams received 35,149 votes in Muscogee, compared with 23,925 for Kemp and 388 for the Libertarian candidate. The county recorded 59,462 total votes in the race.
| 2022 candidate | Muscogee votes | County share | Georgia statewide votes | Statewide share |
|---|---|---|---|---|
| Brian Kemp (R) | 23,925 | 40.24% | 2,111,572 | 53.41% |
| Stacey Abrams (D) | 35,149 | 59.11% | 1,813,673 | 45.88% |
| Libertarian | 388 | 0.65% | — | — |
Abrams led Kemp in Muscogee by 11,224 votes. Statewide, Kemp received 297,899 more votes than Abrams.
Comparing the two elections, Kemp's Muscogee vote share increased from 38.48% in 2018 to 40.24% in 2022. Abrams' share decreased from 60.79% to 59.11%.
The county's total votes in the governor's race decreased from 63,272 in 2018 to 59,462 in 2022.
The outcomes nevertheless remained the same in one respect: Muscogee supported Abrams in both elections, while Georgia elected Kemp statewide both times.
When did Muscogee last vote Republican for governor?
Wikipedia's historical election tally identifies 2006, when Republican Sonny Perdue won reelection, as the last time Muscogee County voted Republican for governor.
Wikipedia marks that claim as needing a citation, and Columbus Times could not independently confirm the 2006 county result.
The same historical reporting lists Muscogee among the counties that changed from Republican in the 2006 governor's race to Democratic in the 2010 election.
The directly reported 2018 and 2022 results confirm Democratic victories in Muscogee in both of those more recent governor's races. They also confirm that Georgia elected the Republican candidate statewide in both elections.
Together, the historical accounts and the more recent county results provide a record of how the county has voted, without establishing a result for the upcoming election.
How did Columbus vote in recent U.S. Senate elections?
Democratic candidates won Muscogee County in the 2021 Senate runoffs, the 2022 general election and the 2022 Senate runoff.
The reported county vote totals were:
| Election | Democratic candidate | Democratic votes | Republican candidate | Republican votes |
|---|---|---|---|---|
| 2021 Senate runoff | Jon Ossoff | 44,875 | David Perdue | 26,626 |
| 2021 Senate runoff | Raphael Warnock | 45,049 | Kelly Loeffler | 26,473 |
| 2022 Senate general | Raphael Warnock | 36,861 | Herschel Walker | 21,496 |
| 2022 Senate runoff | Raphael Warnock | 35,487 | Herschel Walker | 19,433 |
In the 2021 runoffs, Ossoff led Perdue by 18,249 votes in Muscogee, while Warnock led Loeffler by 18,576.
In the 2022 general election, Warnock led Walker by 15,365 votes in the county. The December runoff produced a margin of 16,054 votes between the two candidates.
These contests add to the recent record of Democratic candidates receiving more votes than Republican candidates in Muscogee County.
The figures refer specifically to county results. They should not be used as substitutes for statewide Senate totals.
What's on the ballot in Georgia on Nov. 3, 2026?
Georgia voters will choose a new governor on Tuesday, Nov. 3, 2026, in a race between Democrat Keisha Lance Bottoms and Republican Rick Jackson.
Bottoms is a former Atlanta mayor. Jackson is the founder of Jackson Healthcare. Gov. Brian Kemp is term-limited, leaving the governor's office open in this election.
Early voting began Oct. 13 and continues through Oct. 30. Election Day is Nov. 3.
For Muscogee County voters, the historical record provides context about previous results, including nine consecutive Democratic presidential victories, Democratic county victories in the 2018 and 2022 governor's races, and Democratic victories in the recent Senate contests examined.
However, presidential, Senate and governor's elections are separate contests. Their historical results do not determine how residents will vote in 2026.
Columbus Times does not endorse candidates.
How we did this
Columbus Times reviewed Muscogee County presidential election results from 1952 through 2024 using Dave Leip's Atlas of U.S. Presidential Elections, as reported in Wikipedia's Muscogee County election history. Presidential vote shares were calculated from the historical totals.
The 2018 and 2022 governor comparisons use county and statewide election figures reported in Wikipedia's election articles, which cite the Georgia Secretary of State. Recent U.S. Senate results cover the 2021 runoffs and 2022 general and runoff elections.
Information on the 2026 governor's race and early-voting dates comes from Columbus Times' October 2026 governor's race guide. Historical results describe past voting and are not projections of the Nov. 3 election.
Source: Dave Leip's Atlas of U.S. Presidential Elections; Georgia Secretary of State (via Wikipedia)

News organizations may republish this story with credit. See our guidelines.
Know someone who'd want to read this? Email it to a friend.
Own a Columbus business? 60,000+ page views a month. Ads from $125/month. See ad optionsPlan your weekend with Columbus Times
Get This Weekend in Columbus every Thursday: the best local events, free things to do and family fun, plus each evening's local news. Free, and you can unsubscribe anytime.
Most read this week
- Georgia's 3 Amendments: Which Will Pass, Who's Against Them, and What Happens If They Fail
- Georgia's 3 Constitutional Amendments on the Nov. 3 Ballot, Explained in Plain English
- Early Voting in Columbus Starts Oct. 13: Every Site, the Hours, and What's on Your Ballot
- USDA Awards $3.3 Billion Loan for Georgia Power Plant to Meet Rising Electricity Demand
- Georgia Election Forecast 2026: Who Is Projected to Win Every Major Race?
More stories
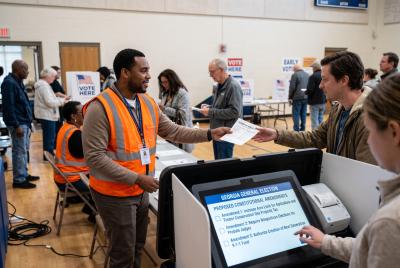 Politics Georgia's 3 Amendments: Which Will Pass, Who's Against Them, and What Happens If They Fail
 Politics 550,000 Georgians Dropped Marketplace Coverage This Year: Doctors, Ossoff and Collins Split Over Who's to Blame
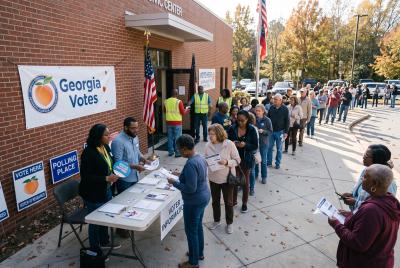 Politics Which of Georgia's 3 Amendments Is Most Likely to Pass? What the Votes, Supporters and History Say
 Politics Georgia Governor's Race: Bottoms vs. Jackson on Taxes, Schools, Health Care and Jobs, in Their Own Words
Comments
Be respectful. No personal attacks, hate speech, spam or anyone's private information. Every comment is reviewed before it appears. Comment rules
No comments yet. Be the first to share your thoughts.