Columbus Metro Has 122,600 Jobs, but Unemployment Rises to 4.3% in September 2026
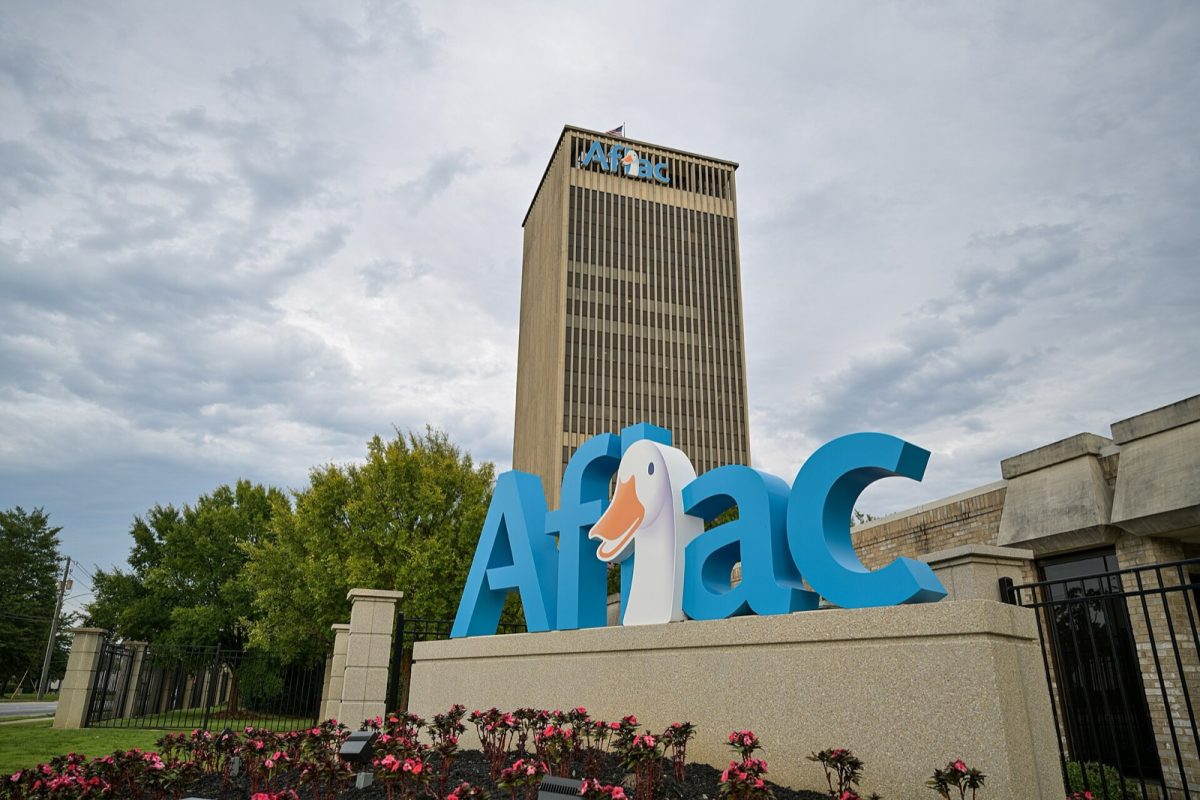
The Columbus metro had 122,600 nonfarm jobs in September 2026, according to the Bureau of Labor Statistics. Shown: the Aflac headquarters campus. Photo: Jhelmsaflac (John David Helms) / Wikimedia Commons (CC BY-SA 4.0)
COLUMBUS, Ga. - The Columbus metropolitan area had 122,600 payroll jobs in September 2026, an increase of 500 jobs, or 0.4%, from September 2025, according to preliminary data from the U.S. Bureau of Labor Statistics. The metro unemployment rate was 4.3%, up from 4.0% a year earlier, while Muscogee County's rate reached 4.4%. The figures show a local job market with modest employment growth and a higher share of workers unemployed than at the same time last year.
The Columbus, Georgia-Alabama metropolitan statistical area includes Columbus and the Phenix City area across the state line. Its employment figures count payroll jobs throughout the metropolitan area, not just jobs within Columbus city limits or Muscogee County. That distinction matters when comparing the region's largest industries, employment trends and unemployment rates.
Columbus Jobs and Unemployment: Numbers at a Glance
The September figures provide a snapshot of employment across the Columbus area. Payroll employment increased slightly over the year, even as unemployment rates rose in both the metro area and Muscogee County. The statewide unemployment rate moved in the opposite direction, declining slightly from September 2025.
| Measure | September 2026 | September 2025 | Change |
|---|---|---|---|
| Columbus metro payroll jobs | 122,600 | 122,100 | +500 |
| Metro job growth | +0.4% | - | - |
| Columbus metro unemployment | 4.3% | 4.0% | +0.3 percentage points |
| Muscogee County unemployment | 4.4% | 4.2% | +0.2 points |
| Georgia unemployment | 3.3% | 3.4% | -0.1 points |
| U.S. unemployment | 4.2% | 4.4% | -0.2 points |
| Metro civilian labor force | 132,000 | Not provided | - |
| Metro unemployed residents | 5,600 | Not provided | - |
The metropolitan, county and Georgia unemployment rates in this table are not seasonally adjusted, while the national unemployment rate is seasonally adjusted. The metro payroll job totals are also not seasonally adjusted. Because the series use different adjustment methods, the most useful local comparisons are generally between the same month in different years rather than between consecutive months.
Year Over Year: Columbus Adds 500 Jobs
Columbus metro employers reported 122,600 payroll jobs in September 2026, compared with 122,100 in September 2025. That represents an increase of 500 positions over the year. The calculation is 500 divided by 122,100, multiplied by 100, which equals approximately 0.41%, or 0.4% when rounded.
The increase was relatively small compared with the overall size of the metropolitan economy. BLS figures show that several earlier months in 2026 had slightly fewer jobs than the corresponding months in 2025. September continued the modest positive year-over-year movement recorded in August, rather than indicating a large expansion in employment.
The monthly figures also show that payroll jobs have not followed a steady upward path. Employment reached its highest reported 2026 level in May before moving lower during the summer. September employment remained below the May figure, although it was above the January level.
Columbus Metro Jobs by Month in 2026
| Month | Payroll jobs |
|---|---|
| January | 121,400 |
| February | 121,600 |
| March | 121,900 |
| April | 122,500 |
| May | 123,300 |
| June | 123,000 |
| July | 122,000 |
| August | 123,200 |
| September | 122,600 |
The highest reported monthly employment total was 123,300 jobs in May, while January had the lowest figure at 121,400. September's total was 600 jobs below August's 123,200. However, these figures are not seasonally adjusted, so a monthly decline does not necessarily establish a deterioration in underlying employment conditions.
The year-over-year comparison offers another perspective on the trend. BLS reported declines of 0.4% in April, 0.2% in May, 0.2% in June and 0.5% in July compared with the corresponding months of 2025. August showed a 0.1% increase, followed by September's 0.4% gain.
Those movements suggest that Columbus area payroll employment has been relatively stable, with modest fluctuations rather than sustained large increases. The data also show why one monthly report should not be interpreted as a complete description of the labor market. A more reliable picture comes from reviewing several months together and comparing each month with the same period a year earlier.
Muscogee County Versus the Columbus Metro
Muscogee County's unemployment rate reached 4.4% in September 2026, compared with 4.3% across the Columbus metropolitan area. The county's rate was 4.2% in August and 4.2% in September 2025. That represents increases of 0.2 percentage points both from the previous month and from a year earlier.
The broader metro unemployment rate rose from 4.1% in August to 4.3% in September. Compared with September 2025, when the rate was 4.0%, the regional increase was 0.3 percentage points. These changes show that the unemployment rate increased over the year in both the county and the larger metropolitan area.
| Area | Sept. 2026 | Aug. 2026 | Sept. 2025 |
|---|---|---|---|
| Muscogee County | 4.4% | 4.2% | 4.2% |
| Columbus metro | 4.3% | 4.1% | 4.0% |
| Georgia | 3.3% | 3.2% | 3.4% |
| United States | 4.2% | 4.1% | 4.4% |
Georgia's unemployment rate stood at 3.3% in September, compared with the Columbus metro rate of 4.3%. That placed the metropolitan area 1.0 percentage point above the statewide rate. Muscogee County's 4.4% rate was 1.1 percentage points above Georgia's rate.
The national unemployment rate was 4.2%, slightly below the Columbus metro's published 4.3% figure. However, the U.S. series is seasonally adjusted, while the local and state rates in this report are not. The adjustment difference means that a direct comparison should be treated cautiously rather than as an exact measure of relative labor market strength.
How Many Columbus Area Residents Are Working?
The BLS reported a civilian labor force of approximately 132,000 people in the Columbus metropolitan area in September. Of those, approximately 126,400 were employed and 5,600 were unemployed. These are rounded estimates from the survey of residents, rather than a count of payroll jobs at local establishments.
In August, the metro labor force totaled approximately 131,300, with 126,000 employed and 5,400 unemployed. Both the estimated employed and unemployed populations increased between the two months. Those changes are useful context, but the unadjusted figures do not establish why the unemployment rate changed.
An important distinction is that the 126,400 employed residents are not the same measurement as the 122,600 payroll jobs. The first figure comes from information about residents' employment status, while the second measures jobs located within the metropolitan area. The two figures should not be added together or interpreted as conflicting estimates of a single employment total.
Which Industries Have the Most Jobs in Columbus?
Government remained the Columbus metropolitan area's largest employment category in September, with 23,900 jobs. Trade, transportation and utilities followed with 19,100, while education and health services accounted for 18,600. Together, those industries represented just over half of the metro's 122,600 payroll jobs.
The industry shares below are calculated by dividing each industry's September employment by the metropolitan total of 122,600 jobs and multiplying by 100. For example, government employment represents 23,900 divided by 122,600, multiplied by 100, or approximately 19.5%. Percentages are rounded to one decimal place, so individual shares may not add to exactly 100%.
| Industry | Jobs | Share of metro jobs |
|---|---|---|
| Government | 23,900 | 19.5% |
| Trade, transportation and utilities | 19,100 | 15.6% |
| Education and health services | 18,600 | 15.2% |
| Leisure and hospitality | 15,300 | 12.5% |
| Professional and business services | 14,300 | 11.7% |
| Manufacturing | 10,600 | 8.6% |
| Financial activities | 10,500 | 8.6% |
| Mining, logging and construction | 5,000 | 4.1% |
| Other services | 4,300 | 3.5% |
| Information | 1,000 | 0.8% |
| Total | 122,600 | 100.0% |
Government employment's 19.5% share makes it a substantial part of the metropolitan economy, but the category does not identify individual employers or current vacancies. Trade, transportation and utilities represented another 15.6%, followed closely by education and health services at 15.2%. The figures describe where existing payroll employment is concentrated, not which organizations are currently recruiting.
The combined leisure and hospitality sector accounted for 12.5% of employment, while professional and business services represented 11.7%. Manufacturing and financial activities each accounted for approximately 8.6% of the region's jobs. The remaining categories accounted for smaller shares of the overall employment total.
Industries Gaining and Losing Jobs
Leisure and hospitality recorded the largest numerical year-over-year increase among the listed industries, growing from 14,900 jobs to 15,300. That represents 400 additional jobs, or approximately 2.7% growth. Professional and business services followed with an increase of 300 jobs, from 14,000 to 14,300, or approximately 2.1%.
Education and health services increased by 100 jobs, while manufacturing also added 100. Other services grew by another 100 positions, and information employment remained unchanged at 1,000. These figures illustrate how gains across several categories contributed to the metro area's small overall employment increase.
| Industry | Annual job change | Annual % change |
|---|---|---|
| Leisure and hospitality | +400 | +2.7% |
| Professional and business services | +300 | +2.1% |
| Education and health services | +100 | +0.5% |
| Manufacturing | +100 | +1.0% |
| Other services | +100 | +2.4% |
| Information | 0 | 0.0% |
| Government | -100 | -0.4% |
| Trade, transportation and utilities | -100 | -0.5% |
| Financial activities | -200 | -1.9% |
| Mining, logging and construction | Not verified | -2.0% |
Financial activities experienced the largest verified numerical decline among the listed categories, falling from 10,700 to 10,500 jobs. Government employment declined by 100 positions, and trade, transportation and utilities also decreased by 100. Mining, logging and construction recorded a published annual decline of 2.0%, although a verified numerical job change was not available in the underlying data collected for this report.
The contrasting industry results help explain why overall job growth was modest. Employment increases in leisure and hospitality and professional services were partly offset by declines elsewhere. These are changes in industry payroll totals, however, and do not independently establish the number of new vacancies, employee separations or individual hiring decisions.
What the Numbers Mean for Job Seekers and Employers
For Columbus area job seekers, the September report points to a labor market that is still supporting approximately 122,600 payroll jobs but experiencing limited overall growth. The metro added 500 jobs over the year while its unemployment rate increased by 0.3 percentage points. That combination does not establish that jobs are unavailable, but it does show that payroll employment growth has been modest.
The industry breakdown provides a useful starting point for understanding where existing employment is concentrated. Government, trade-related businesses, education and health services account for substantial portions of the metropolitan workforce. Meanwhile, leisure and hospitality and professional and business services recorded the strongest verified numerical employment gains over the year.
For employers, the report provides broader labor market context rather than a direct measurement of recruitment conditions. Approximately 5,600 metropolitan residents were classified as unemployed in September, compared with 5,400 in August. These estimates do not identify applicants' skills, qualifications, occupational interests or availability for particular positions.
The report also cannot determine why unemployment increased, whether specific businesses are expanding or how wages have changed. BLS industry totals measure employment across broad economic categories rather than individual company hiring activity. Readers should distinguish the regional employment trends from current job postings, which require separate verification.
Where to Find Job Help in Columbus
Columbus area residents looking for employment information can use the Georgia Department of Labor's local career center and online employment resources. Government and school system employment websites provide additional places to search for position announcements. The listings and available positions may change independently of the monthly BLS employment report.
- Georgia Department of Labor Columbus Career Center: 700 Veterans Parkway, Columbus, GA 31901-2933. Virtual Agent: (877) 709-8185. Website: https://dol.georgia.gov/locations/columbus
- Georgia Department of Labor job resources: https://dol.georgia.gov/find-job
- Columbus Consolidated Government careers: https://www.governmentjobs.com/careers/columbusga. Human Resources: (706) 653-4059.
- Muscogee County School District jobs: https://mcs.schoolspring.com
- The Columbus Times Jobs & Money coverage: https://columbustimes.com/topic/jobs-money
These resources provide starting points for checking employment opportunities and related information. The September BLS data do not verify the number of vacancies available through any of these websites. Job seekers should consult the individual hiring organization's current listings for position requirements, application procedures and deadlines.
About the Data and Upcoming Revisions
The figures in this report come from the U.S. Bureau of Labor Statistics, including its Columbus metropolitan area employment data and public time-series records retrieved Oct. 31, 2026. September 2026 figures are preliminary and subject to revision in subsequent releases. Employment totals are rounded, which can also affect calculations of small monthly and annual changes.
Metro and county unemployment rates and metropolitan payroll employment are not seasonally adjusted, while the national unemployment rate cited here is seasonally adjusted. Comparing September 2026 with September 2025 helps account for recurring seasonal differences in the local figures. The data measure regional labor market conditions, not verified vacancies or employment levels at individual organizations.
The central finding remains a modest increase in Columbus area payroll employment alongside higher local unemployment. The metro's 122,600 jobs represented a 0.4% gain from a year earlier, while its unemployment rate reached 4.3%. Future BLS releases will provide updated figures and revisions that may change the reported totals.
Source: U.S. Bureau of Labor Statistics

News organizations may republish this story with credit. See our guidelines.
Know someone who'd want to read this? Email it to a friend.
Own a Columbus business? 60,000+ page views a month. Ads from $125/month. See ad options Follow Columbus Times on FacebookLocal news, events and people, in your feed every day.Most read this week
- Georgia's 3 Amendments: Which Will Pass, Who's Against Them, and What Happens If They Fail
- Georgia's 3 Constitutional Amendments on the Nov. 3 Ballot, Explained in Plain English
- Early Voting in Columbus Starts Oct. 13: Every Site, the Hours, and What's on Your Ballot
- Georgia Election Forecast 2026: Who Is Projected to Win Every Major Race?
- Columbus Early Voting Ends Friday: 32,307 Muscogee Ballots Cast, 6% Ahead of 2022 Pace
More stories
 Jobs 10 Jobs Most at Risk From AI by 2031: What Columbus and Phenix City Workers Should Know
 Jobs 15 Columbus-Area Jobs That Pay $25 an Hour or More Without a Four-Year Degree
 Jobs Columbus-Area Job Openings: Who's Hiring and What the Jobs Pay
 Jobs 1,200+ Jobs Announced: 6 Columbus-Area Businesses Expanding and Hiring
Comments
Be respectful. No personal attacks, hate speech, spam or anyone's private information. Every comment is reviewed before it appears. Comment rules
No comments yet. Be the first to share your thoughts.