Columbus' 10 Biggest Chattahoochee River Floods Since 1841, Ranked by USGS Records
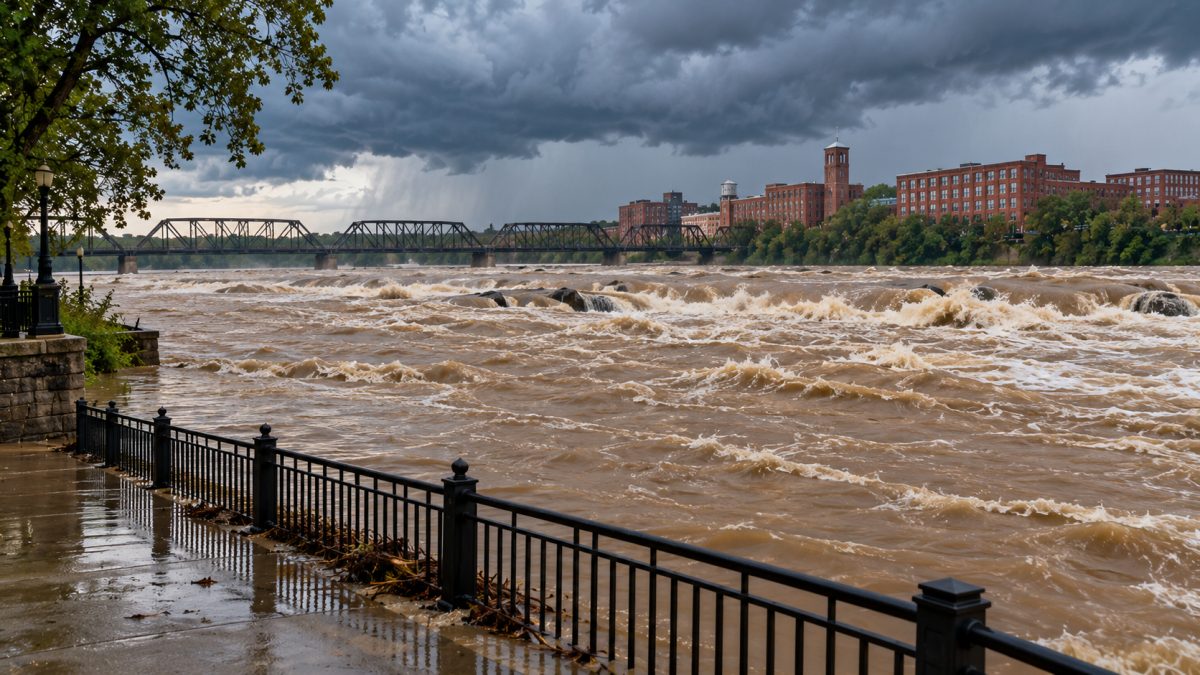
The Chattahoochee's biggest recorded flood at Columbus came on March 15, 1929, at 198,000 cubic feet per second. Illustration: AI-generated
Columbus, Ga., experienced its largest recorded Chattahoochee River flood on March 15, 1929, when the river carried an estimated 198,000 cubic feet of water per second and reached a recorded stage of 55.20 feet. That flood was approximately twice as large, by water flow, as the biggest peak recorded after West Point Lake was filled in 1975.
The second-largest flood occurred Dec. 12, 1919, with 172,000 cubic feet per second. The third-largest came April 1, 1886, at 154,000 cubic feet per second.
Records from the U.S. Geological Survey, or USGS, document major Chattahoochee River floods at Columbus dating to 1841. All 10 of the largest peaks in that record happened before West Point Lake reached its full level in 1975.
The historical figures also reveal another pattern: Many of Columbus' largest river floods occurred during late winter and early spring, particularly March.
Here are the 10 biggest floods recorded at Columbus, ranked by peak river flow, followed by an explanation of how the upstream West Point Dam changed the river's flood history.
How are the biggest Chattahoochee River floods measured?
The USGS records river flooding using two important measurements: streamflow and river stage.
Streamflow describes how much water passes a measuring location each second. It is measured in cubic feet per second, usually abbreviated as cfs.
For example, a streamflow of 100,000 cfs means 100,000 cubic feet of water are passing the measurement location every second. A reading of 200,000 cfs represents twice that volume of water moving past the station in the same amount of time.
River stage is different. It describes the height of the river's water surface relative to a reference level at the measuring station, expressed in feet.
A river stage of 50 feet does not mean the water is 50 feet deep everywhere along the river. It refers to the water level at that specific measurement location and its reference point.
The historical measurements come from USGS station 02341500, Chattahoochee River at Columbus, Georgia.
Several early events are designated by USGS as historic peaks, meaning they were documented before regular streamflow record-keeping. Later entries include measurements from the river's monitored record.
These distinctions matter when comparing floods that occurred more than a century apart.
The 10 biggest Chattahoochee River floods at Columbus
The following countdown ranks the largest recorded peaks from No. 10 to No. 1. Rankings are based on streamflow, not river stage.
No. 10: July 1916, 106,000 cubic feet per second
The 10th-largest flood in the Columbus record occurred in July 1916, when the Chattahoochee reached an estimated peak flow of 106,000 cfs and a recorded river stage of 43.90 feet.
The USGS identifies this event as a historic peak. The exact day in July was not recorded.
This is the only July flood among the 10 largest recorded peaks, making it a seasonal exception in a list otherwise dominated by winter and spring events.
Its peak flow was 1,000 cfs lower than the ninth-ranked flood in March 1913. Although the two events occurred in different seasons, their recorded streamflows were relatively close.
No. 9: March 15, 1913, 107,000 cubic feet per second
On March 15, 1913, the Chattahoochee reached a peak flow of 107,000 cfs at Columbus, with the river stage recorded at 44 feet.
The USGS classifies the event as a historic peak.
The 1913 flood carried approximately 1,000 more cubic feet of water per second than the July 1916 flood. Its stage was also 0.10 foot higher.
The event is one of several major March floods in the historical record. Another March flood, occurring 16 years later in 1929, would ultimately become the largest recorded at Columbus.
The 1913 peak also exceeded the November 1948 flood, ranked 11th, by 3,000 cfs.
No. 8: March 3, 1971, 110,000 cubic feet per second
The eighth-largest recorded flood occurred March 3, 1971, when the Chattahoochee reached 110,000 cfs at Columbus.
A river-stage measurement is not included in the listed peak figures for this event.
The 1971 flood occurred after West Point Dam was completed in August 1970 but before West Point Lake reached its full level in May 1975.
Its flow exceeded the March 1913 flood by 3,000 cfs. It also exceeded the largest recorded post-1975 peak, which occurred in March 1990, by 11,200 cfs.
That distinction is important when examining the dam's history. The dam's completion date and the date the lake reached its full level were different milestones, and the 1971 flood falls between them.
No. 7: March 11, 1841, 113,000 cubic feet per second
The oldest flood documented in the USGS Columbus record occurred March 11, 1841, with an estimated peak streamflow of 113,000 cfs.
The recorded river stage was 45 feet. The USGS identifies the event as a historic peak.
Despite being the oldest event in the record, the 1841 flood ranks seventh by streamflow. Its estimated peak was 3,000 cfs greater than the March 1971 event and 6,000 cfs greater than the March 1913 event.
The 1841 flood also establishes the starting point for the historical period represented in this ranking.
Its inclusion illustrates the distinction between historical peak records and measurements collected during regular streamflow monitoring.
No. 6: Jan. 19, 1925, 133,000 cubic feet per second
The Chattahoochee reached an estimated 133,000 cfs on Jan. 19, 1925, making it the sixth-largest recorded flood at Columbus.
The river stage was recorded at 48 feet, and the USGS classifies this event as a historic peak.
The 1925 flood exceeded the seventh-ranked March 1841 event by 20,000 cfs, a considerably larger separation than those between several of the lower-ranked entries.
It was also 7,000 cfs below the fifth-ranked April 1964 flood.
January 1925 represents one of the winter events on the list. Four years later, Columbus would record a substantially greater flood in March 1929.
That later peak exceeded the 1925 flow by 65,000 cfs.
No. 5: April 8, 1964, 140,000 cubic feet per second
The fifth-largest Chattahoochee flood at Columbus occurred April 8, 1964, with a peak flow of 140,000 cfs.
A corresponding river-stage figure is not listed for this event.
The 1964 peak was 7,000 cfs higher than the January 1925 flood and 5,000 cfs below the February 1961 flood, placing the two events from the 1960s next to each other in the ranking.
The April 1964 event also occurred before construction began on West Point Dam in 1965.
Its inclusion adds another spring flood to the historical list, alongside major March events and the April 1886 peak.
No. 4: Feb. 26, 1961, 145,000 cubic feet per second
On Feb. 26, 1961, the Chattahoochee reached 145,000 cfs, the fourth-largest streamflow in the Columbus record.
The listed USGS figures do not include a river-stage measurement for this event.
The 1961 flood exceeded the April 1964 flood by 5,000 cfs. It was also 9,000 cfs below the third-largest flood, recorded in April 1886.
It is the biggest flood of the 1960s on the list.
Its February date contributes to the concentration of large floods in late winter and early spring.
Like the April 1964 flood, it occurred before West Point Dam construction began.
No. 3: April 1, 1886, 154,000 cubic feet per second
The third-largest recorded Chattahoochee flood at Columbus occurred April 1, 1886, with an estimated peak streamflow of 154,000 cfs.
The river reached a recorded stage of 50.50 feet. The USGS designates this event as a historic peak.
The 1886 flood exceeded the fourth-ranked February 1961 peak by 9,000 cfs, but it was 18,000 cfs below the second-ranked December 1919 flood.
It is the largest April flood in the top 10 and one of three events in that ranking with streamflows exceeding 150,000 cfs.
Its river stage also surpassed the 48-foot reading recorded during the January 1925 flood by 2.50 feet.
No. 2: Dec. 12, 1919, 172,000 cubic feet per second
The second-largest flood occurred Dec. 12, 1919, when the Chattahoochee reached an estimated 172,000 cfs at Columbus.
The recorded river stage was 52.60 feet. The USGS classifies the event as a historic peak.
This flood exceeded the April 1886 event by 18,000 cfs. Its recorded river stage was 2.10 feet higher than the 1886 measurement.
It is also the largest December flood in the ranking and the only December event among the top 10.
Although the December 1919 peak was substantially greater than most other recorded floods, it remained below the March 1929 record.
The difference between the two was 26,000 cfs, with the 1929 event also recording a river stage 2.60 feet higher.
No. 1: March 15, 1929, 198,000 cubic feet per second
The largest Chattahoochee River flood recorded at Columbus occurred March 15, 1929, with an estimated peak flow of 198,000 cfs and a river stage of 55.20 feet.
Both figures are the highest among the historical peaks listed for the station.
The USGS identifies the event as a historic peak. Its flow exceeded the December 1919 flood, the second-largest, by 26,000 cfs.
The 1929 streamflow was approximately 28.6% greater than the third-ranked April 1886 flood of 154,000 cfs.
Compared with the biggest post-1975 peak of 98,800 cfs in 1990, the 1929 flow was approximately twice as large.
The recorded stage of 55.20 feet also stands 14.83 feet higher than the 40.37-foot stage documented during the 1990 event.
No other peak in the USGS Columbus record through 2001 matched the 1929 flood's recorded streamflow.
Why are the biggest floods in Columbus' record so old?
The largest historical peaks occurred before West Point Lake was filled in 1975, and the upstream dam was built partly to control flooding.
West Point Dam was authorized under the Flood Control Act of 1962. Construction began in 1965, and the dam was completed in August 1970.
The lake did not immediately reach its full level. Water was allowed to rise fully after April 30, 1975, and West Point Lake reached full level May 25, 1975.
The project, operated by the U.S. Army Corps of Engineers, includes a 25,864-acre lake upstream of Columbus. It was built for flood control, hydroelectric power generation and water storage to support navigation.
Those purposes are important in understanding the historical changes in river flow. The USGS identifies later streamflow peaks as affected by upstream regulation, including dams.
West Point Dam reduced flood peaks downstream, helping explain why the largest flows in the Columbus record occurred before the reservoir was filled.
The March 1971 flood, ranked eighth, occurred after the dam's completion but before the lake reached full level. The largest listed peak after the lake was filled was the March 1990 flood.
The later peaks were smaller than the largest historical events, but they still involved substantial water flows. The dam reduced flood peaks; it did not eliminate the possibility of flooding.
What were the largest Chattahoochee floods after West Point Lake was filled?
The largest recorded post-1975 peak at Columbus occurred March 17, 1990, when the river reached 98,800 cfs.
Other notable regulated-era peaks occurred in 1992, 1998 and several years between 1978 and 2001.
| Date | Peak streamflow | River stage |
|---|---|---|
| March 17, 1990 | 98,800 cfs | 40.37 ft. |
| Nov. 25, 1992 | 88,500 cfs | 32.89 ft. |
| March 8, 1998 | 75,200 cfs | 31.97 ft. |
| Jan. 26, 1978 | 75,000 cfs | Not listed |
| April 1, 1981 | 73,700 cfs | 30.71 ft. |
| April 14, 1979 | 72,900 cfs | 30.91 ft. |
| July 7, 1994 | 69,000 cfs | 31.24 ft. |
| March 7, 1996 | 68,900 cfs | Not listed |
| March 4, 2001 | 61,100 cfs | 27.41 ft. |
The 1990 peak exceeded the November 1992 event by 10,300 cfs. The March 1998 peak was 23,600 cfs below the 1990 reading.
These events demonstrate that significant river peaks continued after West Point Lake reached full level.
However, the post-1975 figures are not directly interchangeable with an unrestricted historical river system. The USGS identifies later measurements as affected by upstream regulation.
The table also ends in 2001 because that is the end of the station's available historical peak record used for this comparison.
What month has produced the most major floods?
March is the most common month among the 15 largest Chattahoochee River peaks in the Columbus record, accounting for six events.
Those March floods occurred in 1841, 1913, 1929, 1943, 1971 and 1990.
Several other major events occurred in January, February and April, reinforcing the concentration of many large historical peaks in late winter and early spring.
However, the top 15 also includes events from July, November and December. The July 1916 flood ranks 10th, while the December 1919 flood ranks second.
The historical list therefore does not limit major river peaks to a single season.
March accounts for six of the 15 largest events, or 40% of the ranking. That percentage describes the historical peaks examined, not the probability of flooding during a particular month.
It would not be accurate to interpret these records as showing that flooding can occur only during the months represented in the top 15.
How much bigger was the 1929 flood than the 1990 flood?
The March 1929 flood carried approximately twice as much water per second as the March 1990 peak.
The comparison is straightforward:
| Measurement | March 1929 | March 1990 |
|---|---|---|
| Peak streamflow | 198,000 cfs | 98,800 cfs |
| River stage | 55.20 ft. | 40.37 ft. |
Dividing 198,000 by 98,800 produces a ratio of approximately 2.0. The 1929 flood carried about 99,200 more cubic feet of water per second at its peak.
The river-stage difference was 14.83 feet.
These are two separate measurements, and the flow ratio should not be confused with the difference in river height.
The 1990 event was the largest listed after West Point Lake was filled. Comparing it with 1929 illustrates the substantial difference between the biggest historical peak and the largest peak from the later regulated period.
Honorable mentions: Floods ranked Nos. 11 through 15
Five additional events complete the 15 largest Chattahoochee River peaks documented at Columbus.
| Rank | Date | Peak streamflow | River stage |
|---|---|---|---|
| 11 | Nov. 28, 1948 | 104,000 cfs | Not listed |
| 12 | March 22, 1943 | 102,000 cfs | 43.00 ft. |
| 13 | March 17, 1990 | 98,800 cfs | 40.37 ft. |
| 14 | April 3, 1975 | 89,900 cfs | Not listed |
| 15 | Nov. 25, 1992 | 88,500 cfs | 32.89 ft. |
The November 1948 event came within 2,000 cfs of entering the top 10. The March 1943 flood was 4,000 cfs below the July 1916 peak that occupies 10th place.
The 1990 and 1992 entries are especially notable because they occurred after West Point Lake reached full level. They represent the 13th- and 15th-largest peaks in the complete historical ranking.
The April 3, 1975, flood occurred before the lake reached full level in May of that year.
What the historical record tells us
The USGS record shows that Columbus' largest documented Chattahoochee River flood occurred in 1929, followed by major peaks in 1919 and 1886. Those three events exceeded 150,000 cfs, substantially above the largest recorded post-1975 peak.
The record also shows how construction and filling of West Point Lake changed the river's flood history. Later peak flows were affected by upstream regulation, and the largest recorded post-1975 events did not match the highest historical peaks.
That difference does not mean the Chattahoochee can no longer flood. It means the river's largest measured peaks occurred under different upstream conditions than those following completion of the reservoir.
The USGS station record used for this ranking runs from 1841 through 2001. The rankings describe the peaks documented during that period and should not be presented as a complete record of events occurring after 2001.
How we did this
Columbus Times reviewed the U.S. Geological Survey's annual peak streamflow record for station 02341500, Chattahoochee River at Columbus, Georgia, covering 1841 through 2001.
Floods were ranked by peak streamflow in cubic feet per second. River-stage measurements were included where available, and early events identified by USGS as historic peaks were distinguished from later regulated flows.
Information about West Point Dam and Lake, including construction, reservoir filling and project purposes, comes from Wikipedia's West Point Lake article, which cites the U.S. Army Corps of Engineers. Comparisons between flood peaks were calculated from the recorded streamflow and river-stage figures.
Source: U.S. Geological Survey (station 02341500); U.S. Army Corps of Engineers (via Wikipedia)
News organizations may republish this story with credit. See our guidelines.
Know someone who'd want to read this? Email it to a friend.
Own a Columbus business? 60,000+ page views a month. Ads from $125/month. See ad optionsPlan your weekend with Columbus Times
Get This Weekend in Columbus every Thursday: the best local events, free things to do and family fun, plus each evening's local news. Free, and you can unsubscribe anytime.
Most read this week
- Georgia's 3 Amendments: Which Will Pass, Who's Against Them, and What Happens If They Fail
- Georgia's 3 Constitutional Amendments on the Nov. 3 Ballot, Explained in Plain English
- Early Voting in Columbus Starts Oct. 13: Every Site, the Hours, and What's on Your Ballot
- USDA Awards $3.3 Billion Loan for Georgia Power Plant to Meet Rising Electricity Demand
- Georgia Election Forecast 2026: Who Is Projected to Win Every Major Race?
More stories
 Local Columbus Holds On to No. 2 in Georgia by Just 172 People, and Grows for the First Time Since 2020
 Local Columbus Museum Announces Two October Events: Free Fall Festival and Roaring Twenties Mystery Night
 Local Columbus Drivers Spend 21 Minutes Getting to Work, 7 Fewer Than the Georgia Average
 Local What Would It Take to Make Columbus One of Georgia’s 5 Best Cities to Live In?
Comments
Be respectful. No personal attacks, hate speech, spam or anyone's private information. Every comment is reviewed before it appears. Comment rules
No comments yet. Be the first to share your thoughts.